I’ve used this add-on successfully on a different machine but moved to a new machine and had to set everything up again. This is what I’ve done so far (I’m trying it on a brand new project with no modifications whatsoever, just a default Local site):
One more note that I moved from an Intel Mac to an M1/Apple Silicon. I know that, when manually installing xdebug, there are different binaries available. Is it possible that I installed Local such that it thinks I am on Intel? Or that it’s not been updated to check?
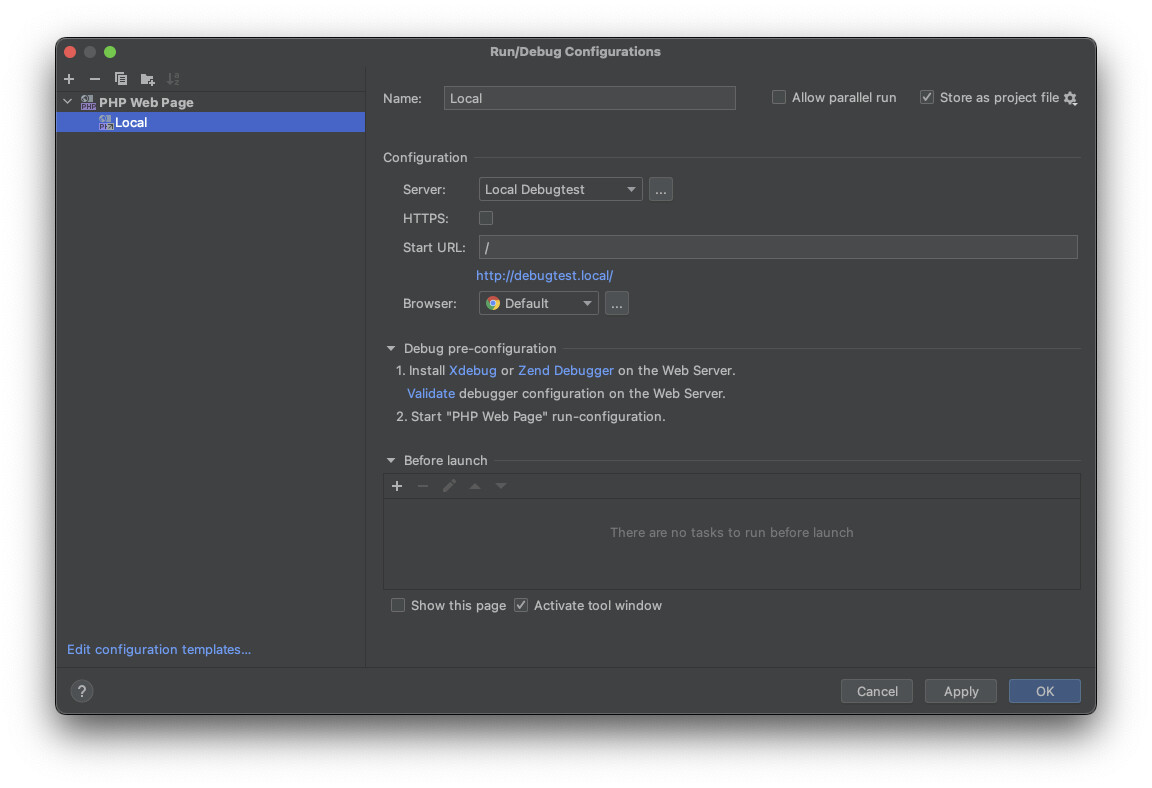
I’m not sure why PhpStorm is not intercepting requests in this case, but perhaps you could try using Xdebug without the Xdebug + PhpStorm add-on, its custom run configuration, or any adjustments to your Xdebug config:
Create a fresh Local site using “Preferred” settings and enable the Xdebug switch in Local.
Open the site’s app/public folder in PhpStorm. (Not the site root folder above those.)
In PhpStorm, visit Settings → PHP → Debug, untick “Force break at first line when a script is outside the project” and click “Apply”.
Set a breakpoint at the first define statement in wp-config.php.
Now, instead of using the add-on to add a debug configuration, in PhpStorm just choose Run → Start Listening for PHP Debug Connections.
Visit your site in any web browser. (You no longer have to start a debug session in PhpStorm to spawn a special debugging browser window.)
You should see an “Incoming connection…” prompt in PhpStorm. Choose the public folder and press Accept:
PhpStorm should focus your breakpoint and suspend execution until you stop or skip in the debugger pane.
Choose Run → Stop Listening for PHP Debug Connections when you’re done debugging.
You’ll have to do this for each site you want to debug, but only once. Start subsequent debugging sessions just by choosing “Start Listening…” from the Run menu, setting a breakpoint and refreshing your browser.
I tested this with Local 7.0.2 on Intel and Apple Silicon Macs and it works consistently on both for me.
Thanks so much for taking the time to write out these detailed instructions for me. I was able to get it working on the generic site as well as my project site. Is there any disadvantage to running it this way vs the add-on supplied custom run configuration?
Glad it helped, Tai! Thank you for trying those steps.
The only disadvantage I’ve found is that the steps above won’t work with Local sites using PHP 5 (you have to use PHP 7 or higher). But I still prefer it because it requires no add-ons or run configuration, and WordPress plans to drop support for PHP 5 soon anyway.
It’s also the debugging setup that JetBrains now recommends: they call it zero-configuration debugging. Their setup steps are similar to mine above, except that you don’t need any browser extensions to initiate the debug session with Local. (Local uses Xdebug 3 with start_with_request=yes in php.ini, so any requests will trigger the debugger if it’s running – there is no need to set Xdebug variables via browser extensions that alter GET variables or cookies to start the session.)
The Local team has now deprecated the Xdebug + PhpStorm add-on, and has a walkthrough to use Local with Xdebug and PhpStorm without add-ons or having to edit php.ini.